Ductile Tearing Instability of a Cracked Gas Turbine Disk
The question was how deep a crack in a gas turbine disk hub can grow before it tears unstably at full speed: about 12–14 mm at 3600 rpm, well above what ultrasonic inspection reliably detects. An ASTM E1820 toughness test on rotor steel, combined with an elastic-plastic Abaqus crack model through the J-integral tangency criterion.
- Project
- Case study, Politecnico di Milano
- My role
- Toughness test, FEA and verification
- Tools
- Abaqus/Standard
- Method
- J-integral tangency criterion (Paris–Tada–Zahoor–Ernst)
- ≈14.0mmcritical initial hub crack depth before unstable ductile tearing, 3600 rpm
- 12.0mmwith the experimental R-curve (−14%)
- 167.2kJ/m²valid initiation fracture toughness, JIc (ASTM E1820)
- ±2%deepest-point J, contours 4–10
Skills shown
How I did it
Determine, for a semicircular flaw postulated at the bore of a rotating gas turbine disk hub, the initial crack depth beyond which stable ductile tearing becomes unstable at the rated operating speed, using a fracture toughness curve established by physical test rather than an assumed material property.
- Experimentally characterize the disk material’s elastic-plastic fracture toughness (JIc) and crack growth resistance (J-R) curve, per ASTM E1820, using the single-specimen elastic unload/reload method on a compact-tension specimen.
- Build a two-stage Abaqus elastic-plastic FE model of a semicircular hub bore crack under rated-speed centrifugal loading, using a global disk model and a locally refined submodel, and extract the J-integral by the domain (contour) integral method.
- Apply the Paris–Tada–Zahoor–Ernst tangency criterion to the resulting crack driving force curve to compute the critical initial crack size.
- Verify the FE result against an independent closed-form hand calculation and a J-integral path-independence check, and validate the measured toughness against published data for comparable rotor steels.
- Connect the two halves of the study with a sensitivity check: repeat the critical crack size calculation using the own single-specimen R-curve in place of the reference curve.
-
Part 1: test the fracture toughness
ASTM E1820
A standard compact-tension, C(T), specimen of a power-engineering-grade 9–12% chromium martensitic stainless rotor steel was fatigue precracked, side-grooved, and tested by the ASTM E1820 single-specimen elastic unload/reload resistance-curve method to establish a full J-R curve from one test.
The specimen was loaded quasi-statically with periodic partial unload/reload cycles; each cycle’s elastic compliance converts to an instantaneous crack length, so a single specimen generates the full sequence of J–Δa points that would otherwise require a six-specimen test population.
- J computed as the sum of elastic and plastic components at each unload point (ASTM E1820 Annex A1).
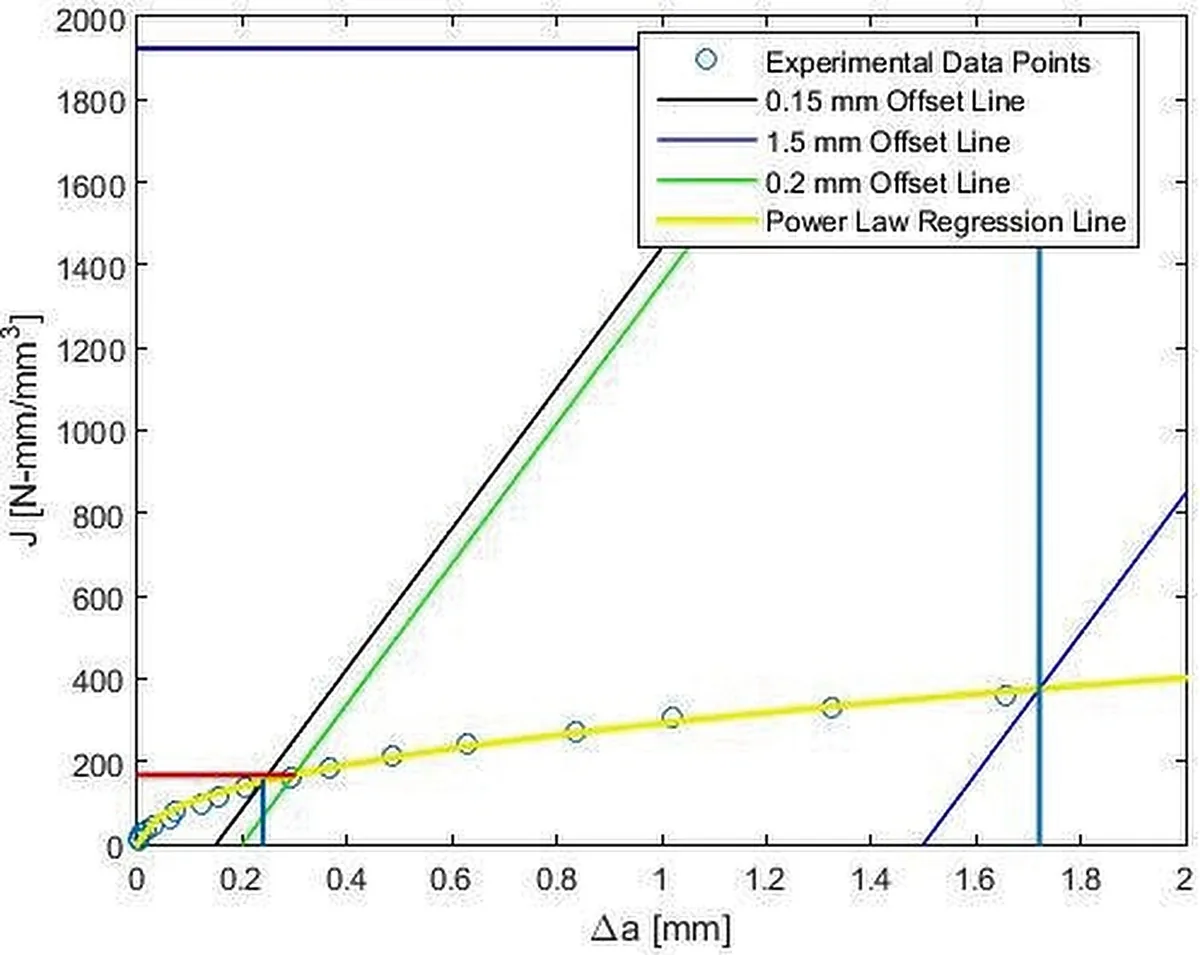
- Power-law resistance curve fitted to the qualified data range: J = C1ΔaC2.
- JIc taken at the intersection of the fit with the 0.2 mm offset construction line.
- Post-test 9-point fractography used to verify compliance-based crack length estimates.
Fitted resistance curve: J = 29.49 Δa0.642 (kJ/m², mm), qualified over Δa = 0.239–1.721 mm. This toughness value places the material centrally within the published range for comparable rotor steels and is carried forward as an independent, test-based cross-check on the disk’s critical crack size.
- Valid initiation toughness, JIc
- 167.2 kJ/m²
- Yield / ultimate strength
- 703 / 836 MPa
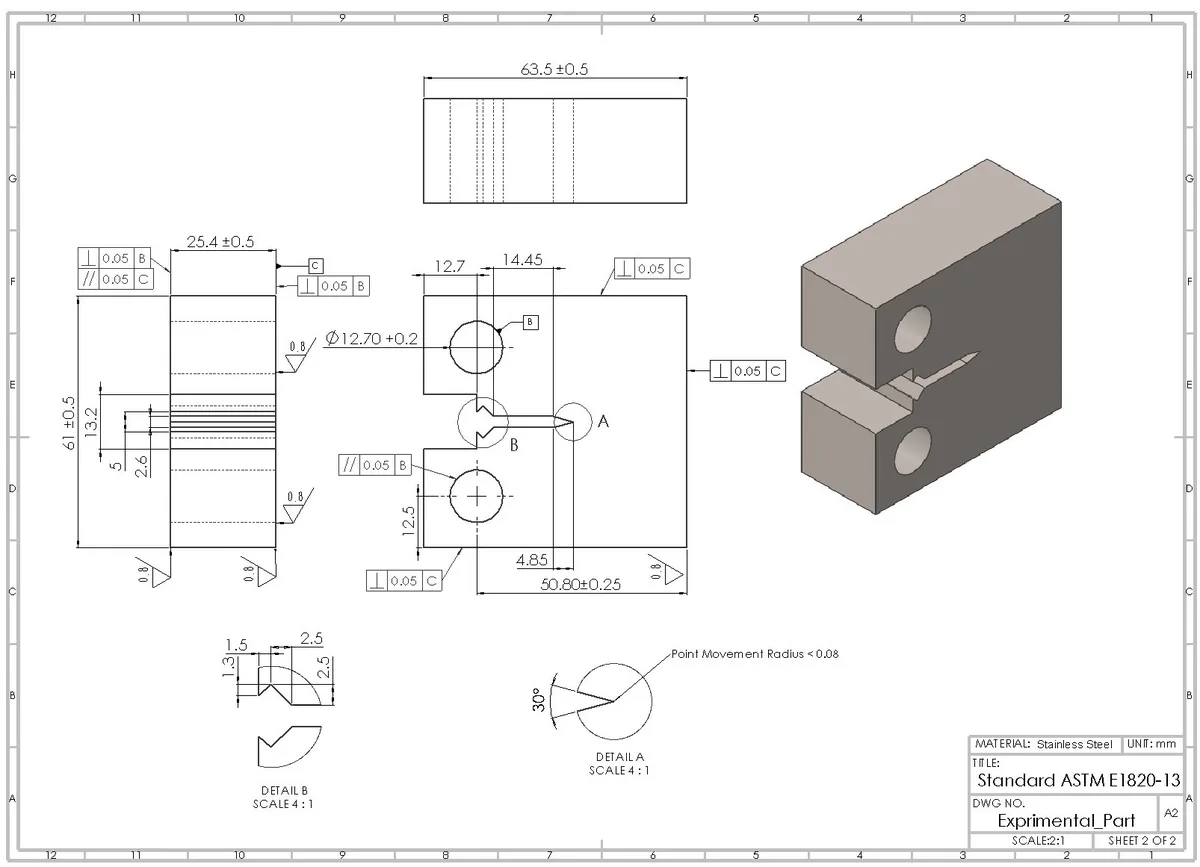
- Specimen W, B / Bn
- 50.8 mm, 25.4 / 20.4 mm
- Initial crack, a0
- 33.78 mm (a0/W = 0.665)
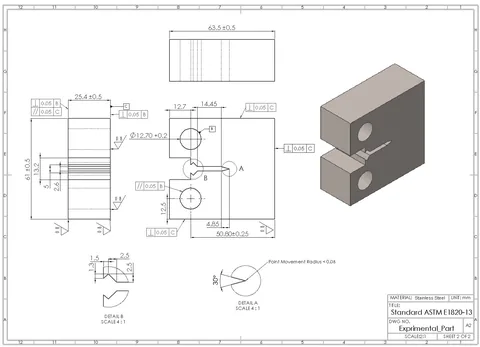
C(T) specimen engineering drawing (ASTM E1820): principal dimensions, GD&T tolerancing, chevron-notch detail, and isometric render of the machined halves. Select to enlarge. 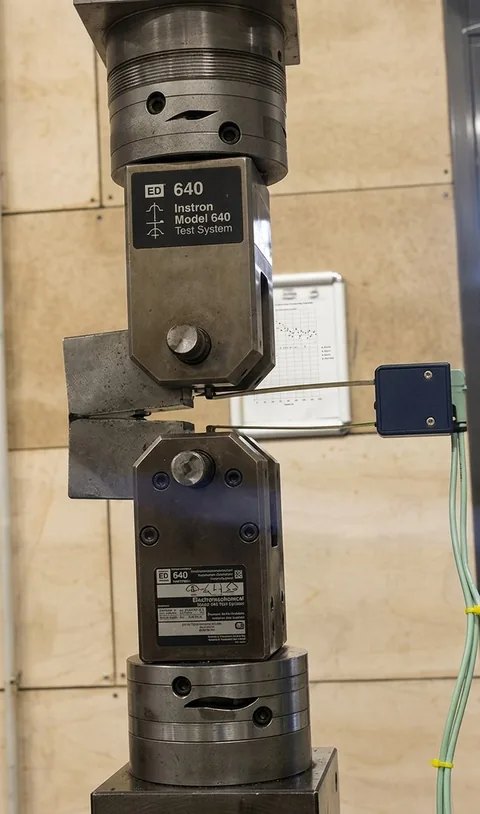
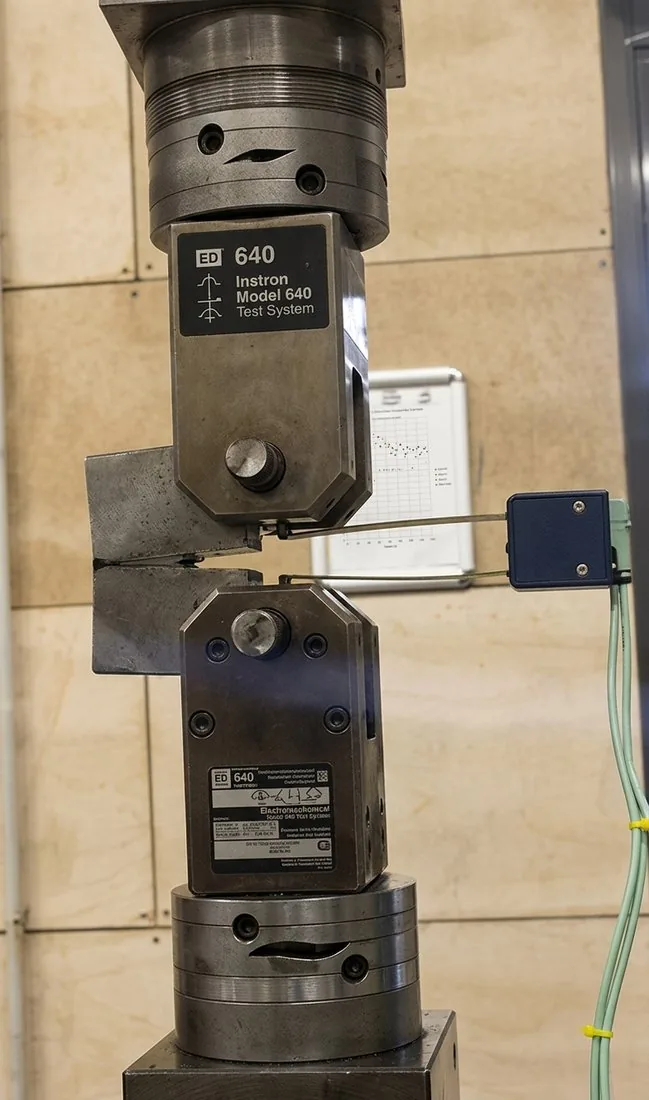
Representative electromechanical test system (Instron Model 640 class) configured for ASTM E1820 testing, with a clip-gauge extensometer across the crack mouth. 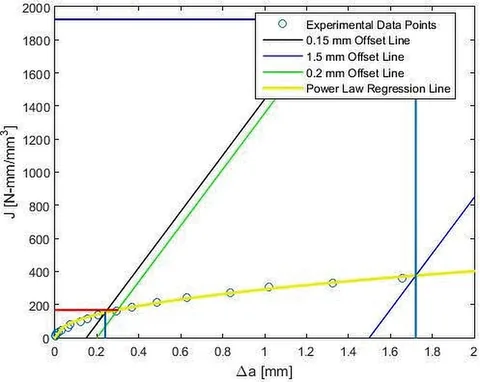
J–Δa resistance curve: test data, ASTM E1820 construction lines, and power-law regression. Select to enlarge. Specimen material properties and dimensions Property / dimension Symbol Value Elastic modulus E 206,817 MPa Yield strength (0.2% offset) σYS 703 MPa Ultimate tensile strength σUTS 836 MPa Specimen width W 50.8 mm Thickness / net thickness (side-grooved) B / Bn 25.4 / 20.4 mm Initial (fatigue precrack) length a₀ 33.78 mm (a₀/W = 0.665) -
Select the disk material
Material selection
Before adopting the tested steel as the disk material, it is benchmarked against the two other realistic candidate classes for a rotating turbine disk, on strength, toughness, service temperature and cost.
The 9–12% Cr martensitic stainless grade is selected: it is the only candidate here backed by a direct test result rather than an assumed property, it comfortably covers the elevated-temperature condition represented in the FE model, and it offers a materially better corrosion margin than the low-alloy steel at a fraction of the cost premium of a nickel superalloy, which remains the identified upgrade path if a hotter or higher-speed application demands it.
Disk materials compared Property Low-alloy NiCrMoV 9–12% Cr stainless (tested) Ni-superalloy (IN718 class) Yield strength (RT) ≈ 600–800 MPa 703 MPa (measured) ≈ 1030–1170 MPa Fracture toughness, JIc ≈ 150–300 kJ/m² 167 kJ/m² (measured) ≈ 80–150 kJ/m² Max. service temperature ≈ 450–480 °C ≈ 580–600 °C ≈ 650–700 °C Corrosion / oxidation resistance Moderate Good Very good Relative material & processing cost Baseline (1.0×) ≈ 1.2–1.4× ≈ 4–6× -
Part 2: model the cracked disk
Abaqus/Standard
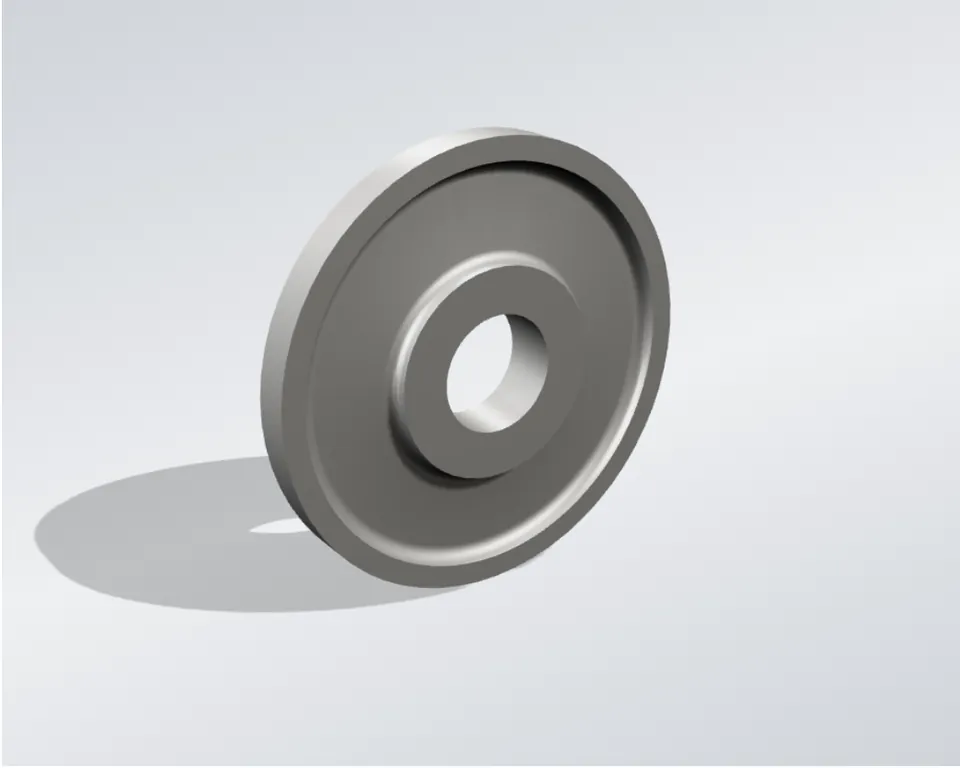
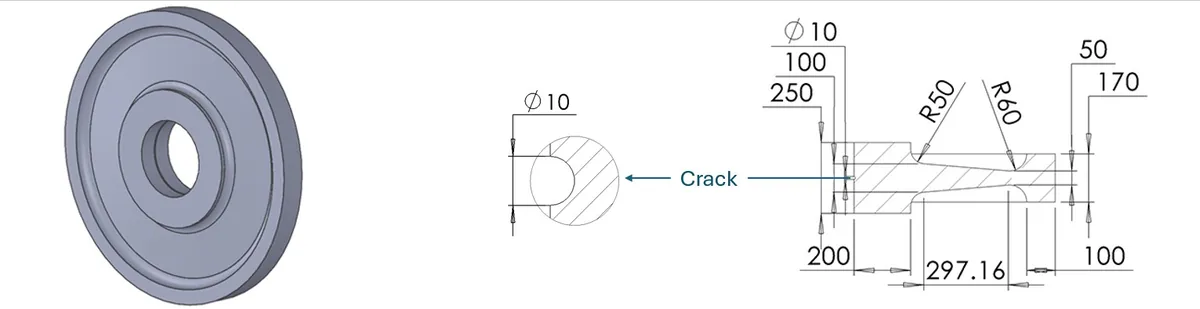
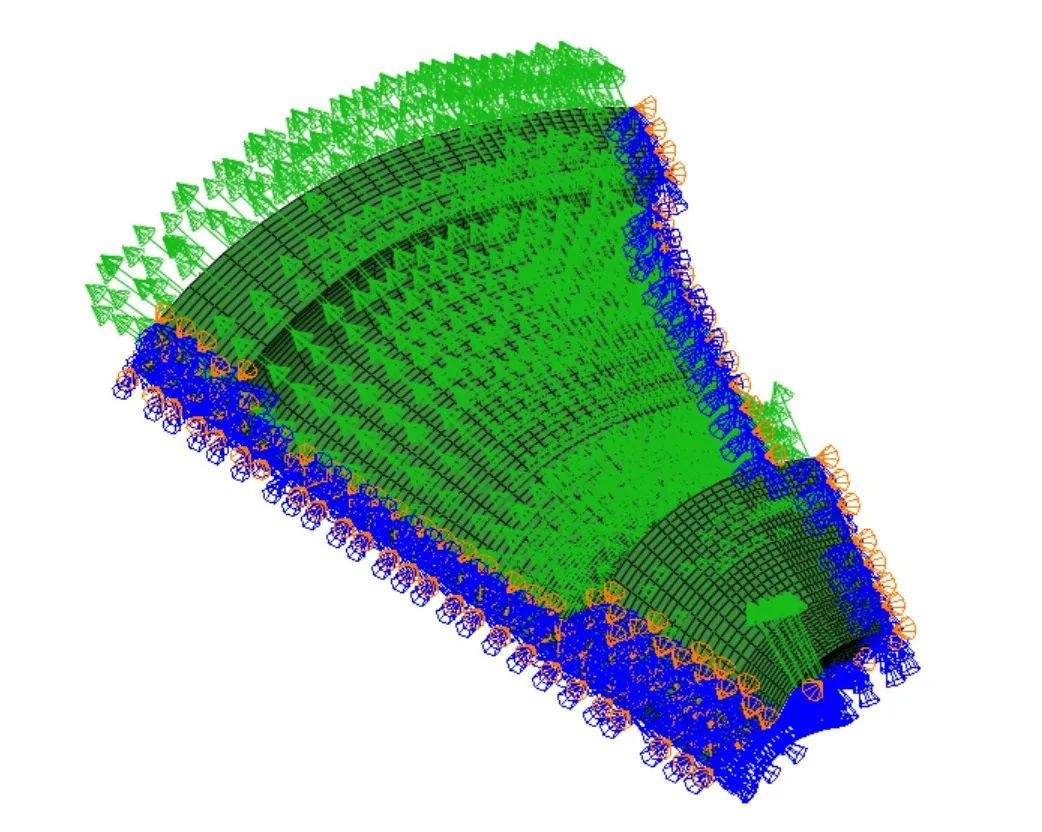
A simplified but dimensionally representative axisymmetric disk profile (thickened hub, tapered web, thickened rim) is analyzed at rated speed with a semicircular crack postulated at the hub bore, using a global model refined by a locally driven submodel.
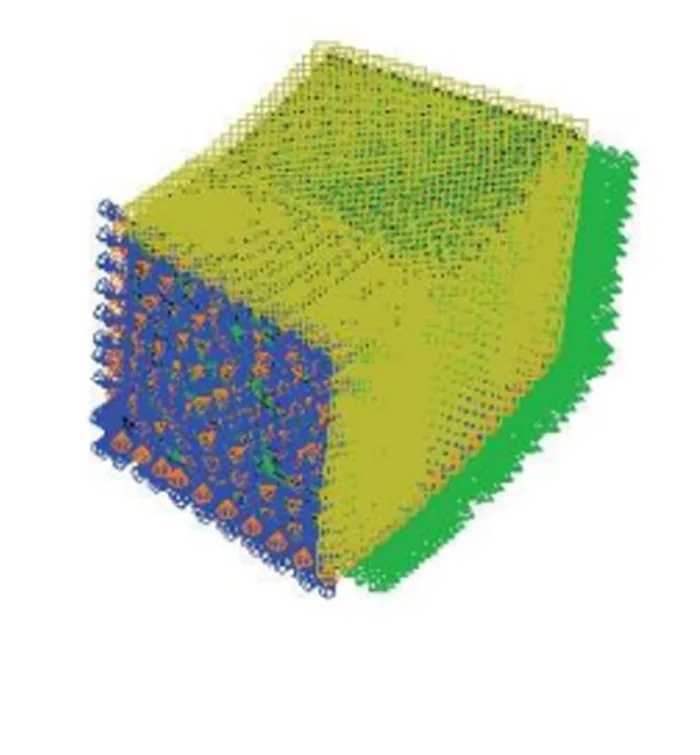
Both models are built as 2D axisymmetric meshes, then revolved into a 3D orphan-mesh sector to capture the position-dependent J-integral along the semicircular crack front. The submodel’s cut faces are driven by displacements imported from the converged global solution, standard practice for resolving a crack tip singularity without refining an entire component model.
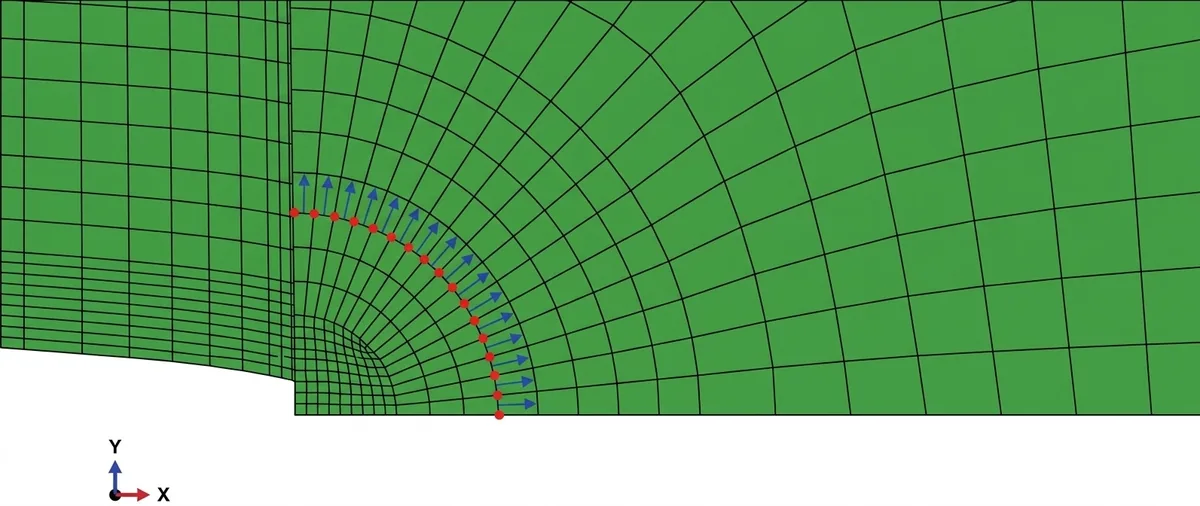
- Global mesh: 8 mm elements, refined to 4 mm near the crack, with a focused 24-element ring at the crack tip.
- Elastic-plastic material: E = 170.5 GPa, σy = 550 MPa (true-stress hardening table), representative of ≈520–540 °C disk metal temperature.
- Loading: rotational body force at ω = 377 rad/s only; crack faces left free, symmetry on the revolved sector cuts.
- J-integral requested as a contour (domain) integral over 10 successive rings, at both the deepest and free-surface points of the crack front.
- Rated speed
- 3600 rpm (377 rad/s)
- Bore-to-rim radius
- 252–960 mm
- Postulated crack
- 10 mm, a = c
- Model
- 2-stage: global model + submodel
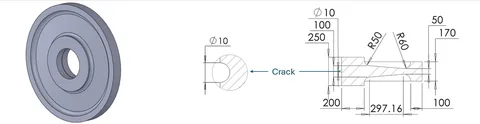
Disk geometry: isometric render, postulated hub bore crack cross-section (Ø10 mm), and dimensioned half-section (hub height 250 mm, fillets R50/R60, rim height 170 mm). Select to enlarge. 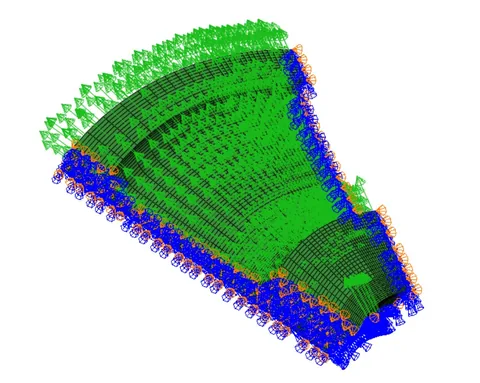
Global model: 3D orphan mesh with applied load, symmetry BCs on cut faces. 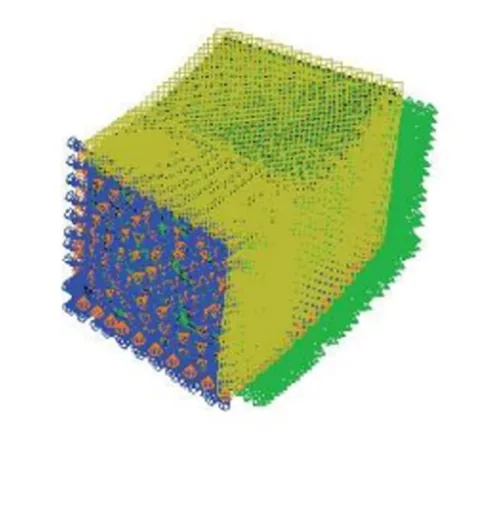
Submodel: locally refined mesh with crack-front loading and global-model-driven boundary conditions. 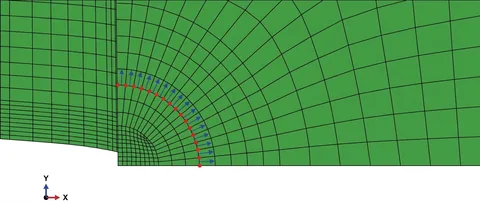
Focused crack-tip ring mesh, 24 elements around the tip, resolving the singularity. Select to enlarge. -
Find the critical crack size
Tangency criterion
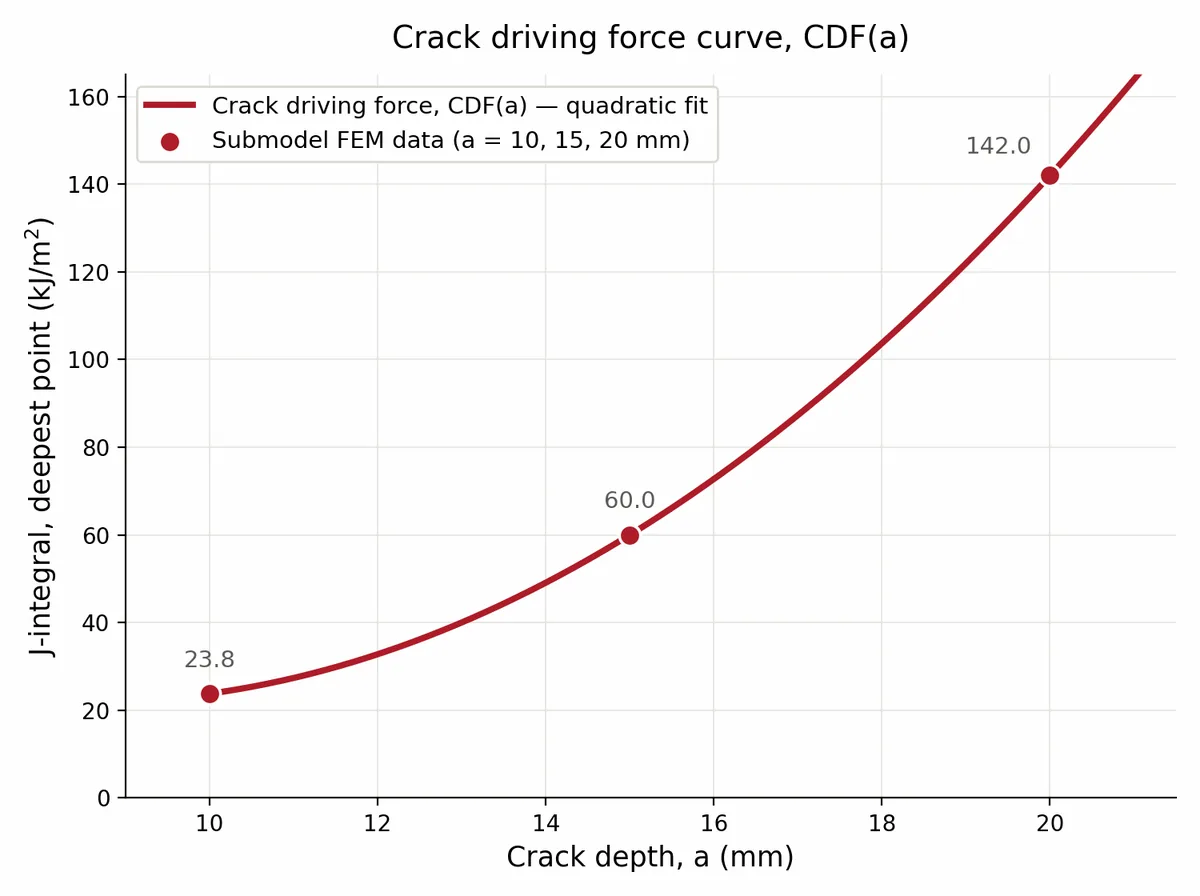
The crack driving force curve, from three submodel solutions at initial crack depths of 10, 15 and 20 mm, is compared against the material’s resistance curve using the tangency (Paris–Tada–Zahoor–Ernst) instability criterion.
The reference R-curve is shifted along the crack-depth axis (dotted line in the chart below) until it is exactly tangent to the driving force curve. That shift, not the point of tangency itself, is the critical initial crack size: a0,cr = 13.99 mm.
Tangency itself occurs at a larger depth, a* = 16.21 mm (J = 75.6 kJ/m²), matching the original graphical shift-and-compare construction within 0.1%. Below a0,cr, the driving force stays under the resistance curve everywhere along the growth path, so any small tearing increment self-arrests.
- Critical initial crack depth
- ≈14.0 mm (13.99 mm)
- Tangency point
- a* = 16.21 mm, J = 75.6 kJ/m²
Submodel crack driving force, deepest point Initial crack depth, a (mm) J-integral, deepest point (kJ/m²) 10 23.79 15 60.0 20 142.0
Tangency-criterion construction
Crack driving force vs. crack depth, plotted against the reference and own R-curves. Hover a marker for detail.
How I checked the results
Verification confirms the model is solved correctly; validation confirms the material input is consistent with independent, published data. Both are required before the critical crack size supports an engineering conclusion.
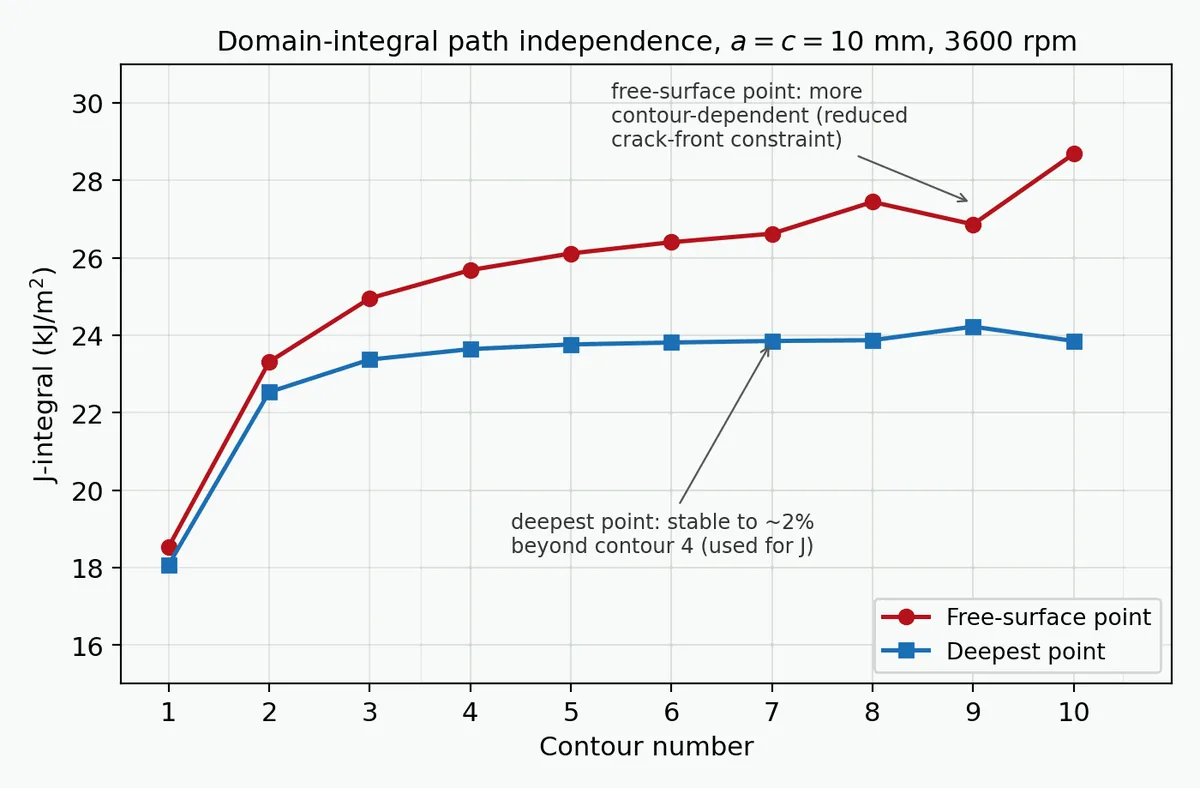
- Domain independence: ±2% at the deepest pointJ stabilizes from contour 4 onward (23.64–23.87 kJ/m²), confirming the mesh resolves the crack tip without contour-dependent drift.
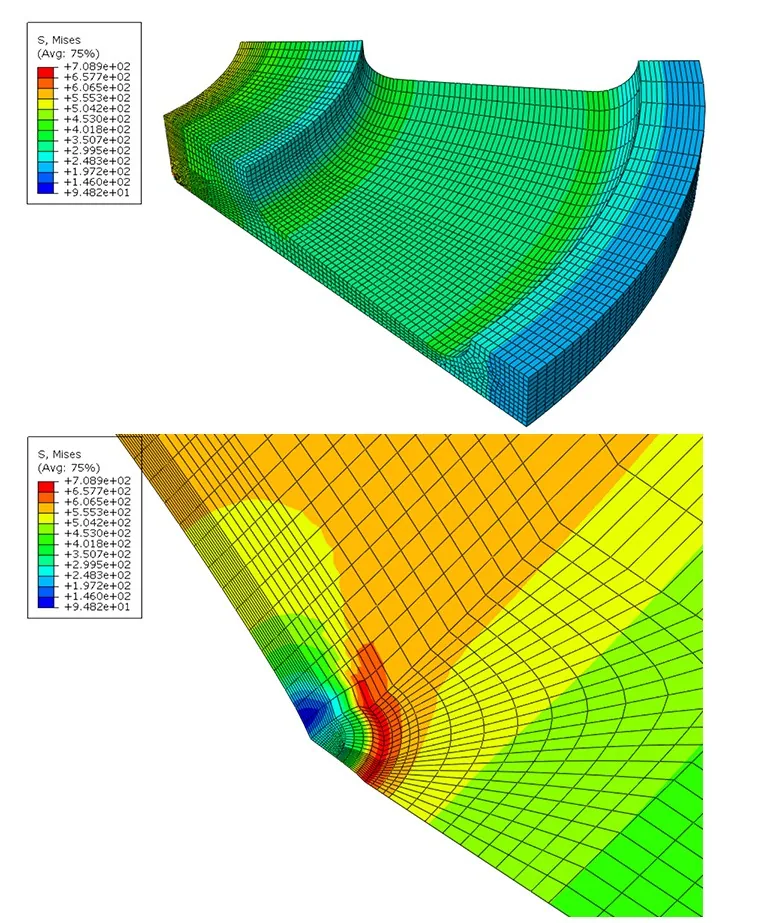
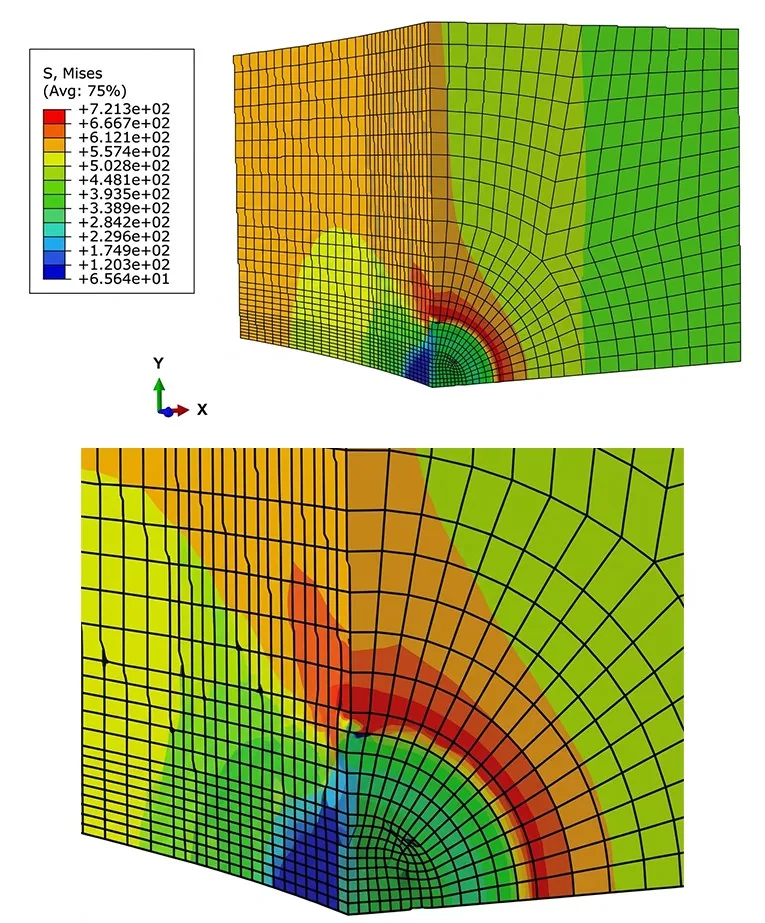
- Global model vs. submodel: 3.2% agreementPeak stress rises from 698 to 721 MPa under local refinement, the expected magnitude and direction for a well-posed submodel.
- Hand calculation: correct order & directionThe closed-form calculation gives σθ(bore) ≈ 850 MPa against an FEM value of 340–450 MPa, over-predicting by the factor expected from ignoring the disk’s hub thickening, exactly as intended.
- Literature validation: 167 kJ/m² falls centrally in rangePublished JIc for comparable rotor steels spans roughly 100–300 kJ/m²; the measured value sits centrally, consistent with a normally tough material.
| ASTM E1820 qualification check | Value obtained | Result |
|---|---|---|
| Regression exponent, C₂ < 1 | C₂ = 0.642 | Satisfied |
| Thickness, B > 10 JQ/σY | 25.4 mm > 1.97 mm | Satisfied |
| Ligament, b₀ > 10 JQ/σY | 17.02 mm > 1.97 mm | Satisfied |
| Crack length ratio, 0.45 ≤ a₀/W ≤ 0.70 | a₀/W = 0.665 | Satisfied |
Engineering judgment and recommendations
Beyond the pass/fail number, the analysis points to where the design has margin and where a real fitness-for-service decision would need more than this single-load-case study provides.
-
Comfortable margin over NDE detection threshold
A 12–14 mm critical flaw sits well above the few-millimeter reliable detection threshold of the ultrasonic and surface NDE methods normally applied to rotor bores, supporting continued service under a periodic inspection program sized against that margin.
-
Flagged
Overspeed reduces the margin, not yet quantified
Centrifugal stress scales with ω² and the elastic crack driving force J with the square of the stress, so J scales with ω4: a 10% test overspeed raises it by about 1.46× and lowers the critical crack size. A full quantification would re-run the tangency construction at overspeed, recommended as follow-on work.
-
Flagged
Base a real decision on a multi-specimen R-curve
The 14% sensitivity (Analysis 3 in the technical details) between two individually defensible resistance curves means a single-specimen test, however well qualified, should not by itself support a life or inspection-interval decision for an actual rotor.
-
Scope: single, static load case
The analysis covers one constant 3600 rpm condition with centrifugal load only: no thermal or assembly stress, no transient start/stop cycling, and an idealized rather than as-found defect geometry.
Technical details
The three analysis stages behind the reported critical crack size.
Analysis detail Global model and submodel stress, J-integral extraction, and sensitivity to the R-curve source
Each stage of the FE workflow, from global model to sensitivity study, verified in turn before the critical crack size is treated as the reported result.
01. FE stress results: global model and submodel
Purpose
Solve the full disk under rated-speed load for an overall stress field and a first-pass J-integral, then locally refine at the crack tip with a submodel driven by the global solution, without the cost of refining the whole disk.
The 3.2% rise on refinement, in the expected direction, is what a well-posed submodel should show, not an inconsistency between the two models.
02. J-integral extraction and driving force curve
Purpose
Confirm the domain-integral J is mesh-converged across 10 contour rings, then fit the three submodel solutions (a = 10, 15, 20 mm) to a continuous crack driving force curve, CDF(a), for the tangency construction in step 4.
CDF(a) = 0.9157 a² − 15.65 a + 88.72 (a in mm, J in kJ/m²)
The deepest point governs the curve, since it is both numerically stable and the highest-constraint location along the crack front.
03. Sensitivity to the R-curve source
Purpose
Connect the two halves of the study directly: repeat the tangency construction of step 4 using the experimental single-specimen R-curve from Part 1 (C₁ = 29.49, C₂ = 0.642) in place of the multi-specimen-representative reference curve (C₁ = 54.45, C₂ = 0.412).
The 14% shift between two individually defensible resistance curves is the practical basis for the recommendation that a real fitness-for-service decision use a multi-specimen curve.