
Bicycle Crank Arm: Structural FEA Verification
The question was whether an aluminum bicycle crank arm can safely take a rider’s pedaling force: it has three times the strength it needs, but fatigue from repeated pedal strokes leaves only about 5% margin. Static FEA in ANSYS under a 444.8 N pedal load, checked by an independent hand calculation and an equilibrium check, with a material trade study behind the choice of 6061-T6.
- Project
- Case study, Cornell University (online course)
- My role
- CAD, FEA, hand calculations and material selection
- Tools
- SolidWorks, ANSYS Mechanical
- Method
- Static structural FEA + hand-calc verification
- 3.0×static factor of safety against yield (σy 276 MPa ÷ σmax 91.5 MPa)
- 91.5MPapeak bending stress, tension in the lower fiber of the neck
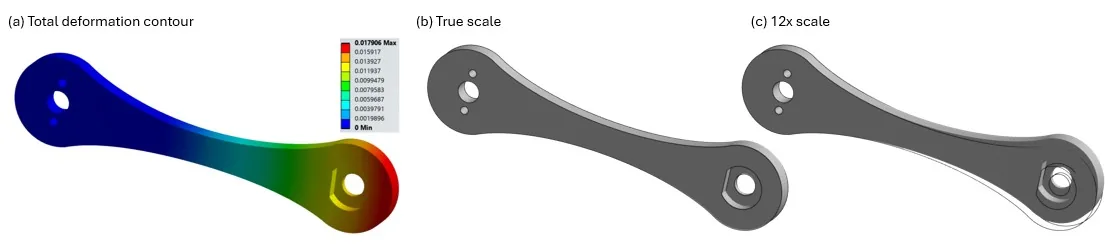
- 0.455mmmax total deformation at the pedal-side hole
- ≈1.05margin to the high-cycle fatigue strength (≈96.5 MPa)
Skills shown
How I did it
Determine the deformation and stress state of the crank arm under a representative pedaling load, verify the finite element solution against an independent analytical check, and establish whether the design carries an adequate margin for both static strength and fatigue life.
- Solve the deformed shape and displacement field of the crank under a 444.8 N pedal load using a 3D linear-elastic FE model.
- Recover the peak normal (bending) stress at the critical cross-section and confirm its location and sign against beam-bending intuition.
- Verify the FE solution with an independent Euler–Bernoulli hand calculation and a reaction-force / traction equilibrium check.
- Select and justify the crank material against realistic alternatives on strength, fatigue life, and manufacturability.
- Establish the static factor of safety and flag whether a dedicated fatigue study is required before production release.
-
Model the crank and its load case
SolidWorks
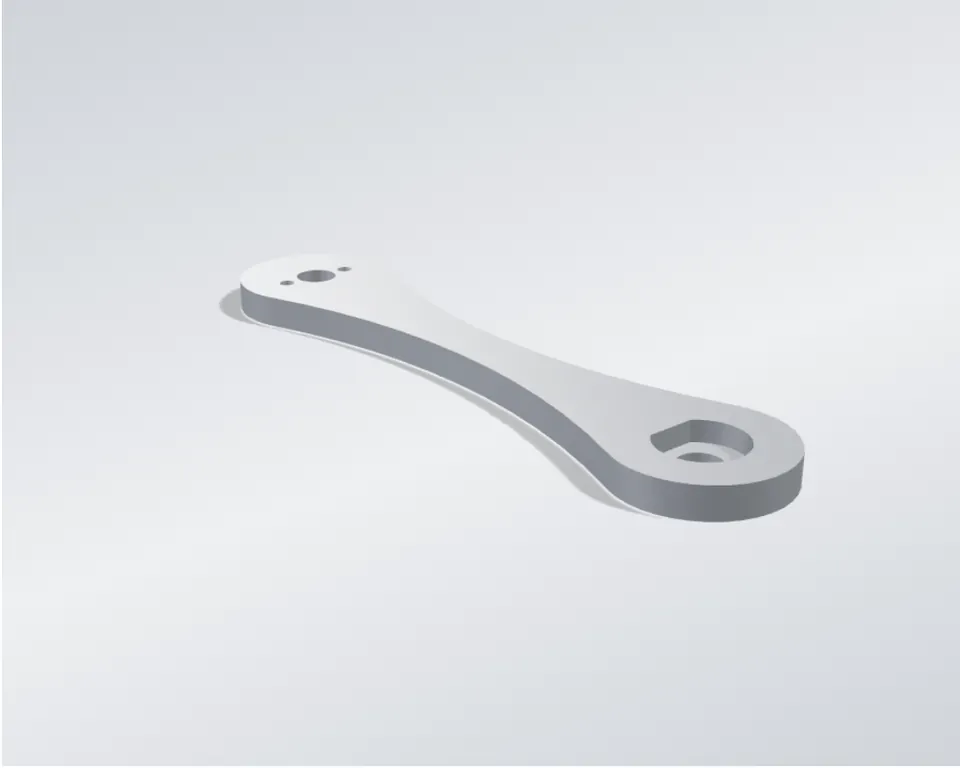
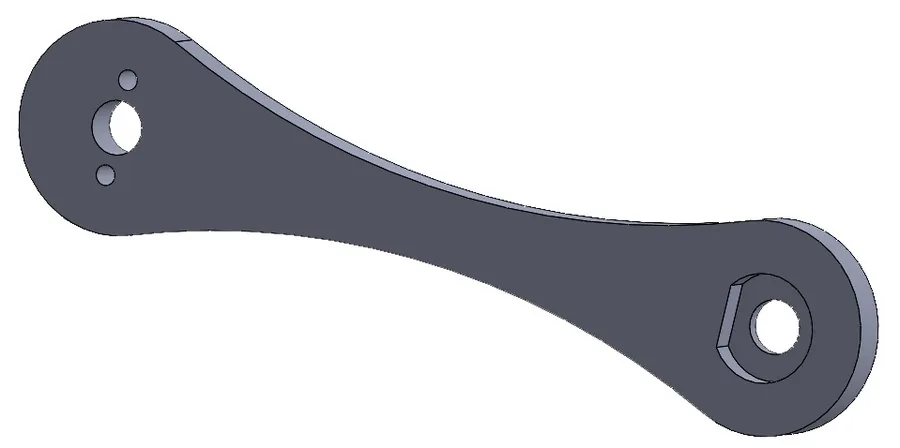
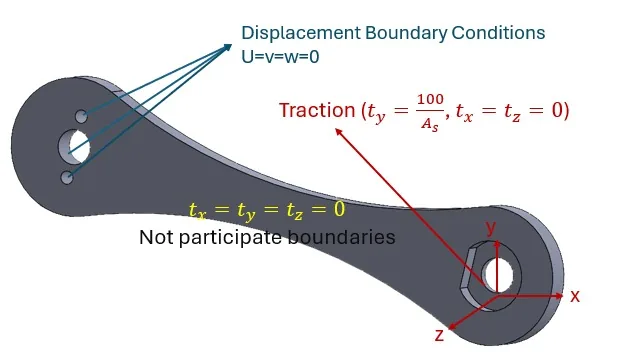
Single-piece crank arm modeled in SolidWorks and analyzed as a cantilever: the three-hole bottom-bracket boss is fixed, and the single-hole pedal boss carries the rider’s pedal load.
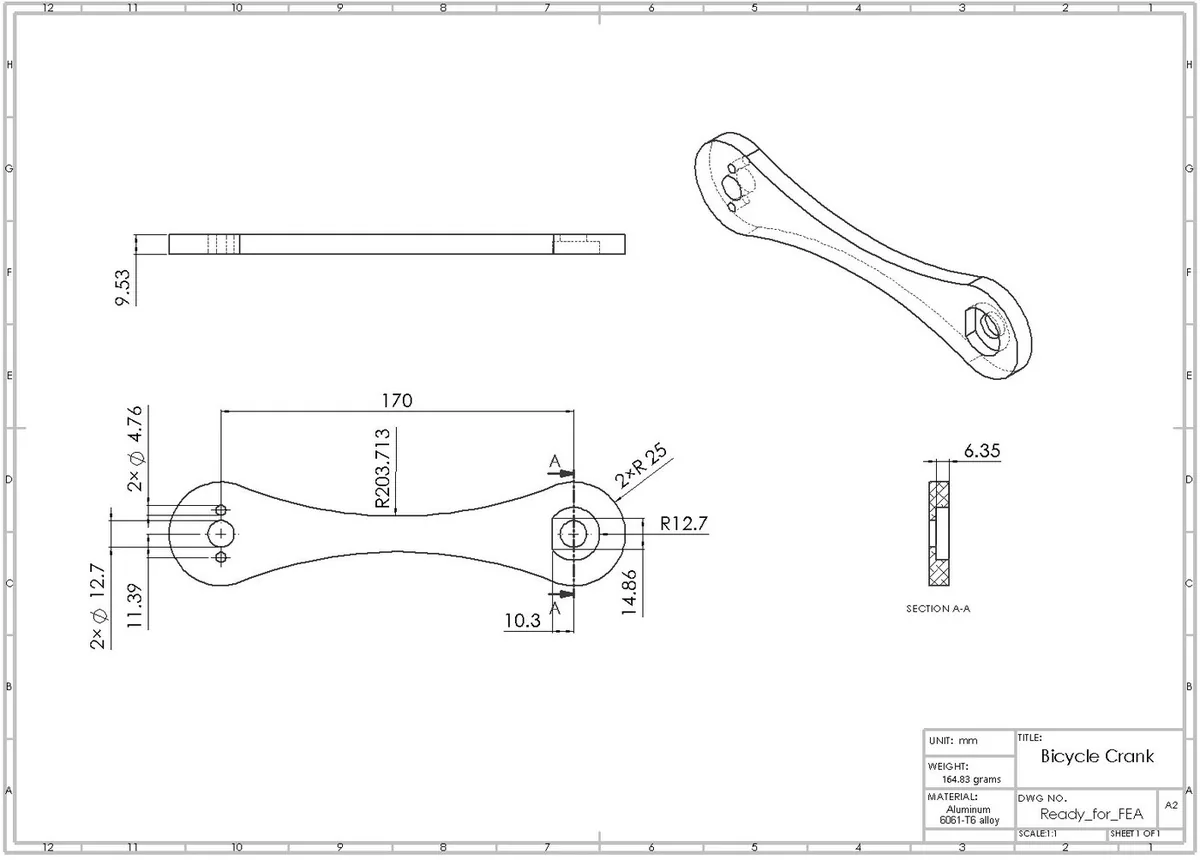
- Hole-to-hole span
- 170 mm
- Neck section thickness
- 6.35 mm
- CAD-computed mass
- 164.8 g
- Pedal load
- 444.8 N (100 lbf)
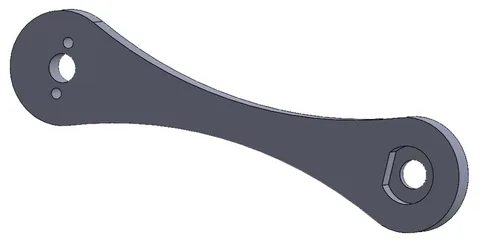
Isometric view of the crank-arm solid model (SolidWorks). 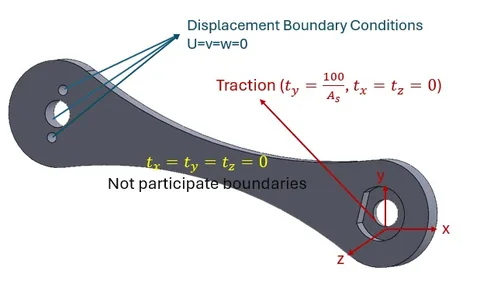
Boundary conditions: fixed support at the three bottom-bracket holes; 444.8 N traction at the pedal-side hole. 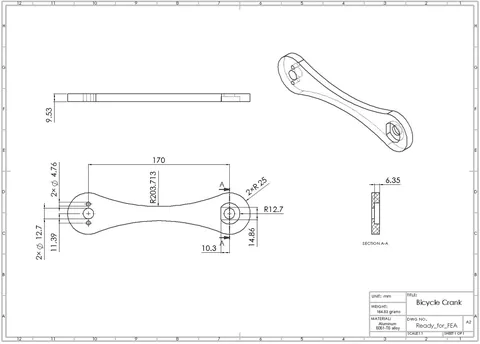
Fully dimensioned engineering drawing (SolidWorks), sheet 1 of 1. Select to enlarge. -
Choose the material
Material selection
Aluminum 6061-T6 was benchmarked against three realistic crank-arm alternatives before being adopted, since material choice governs strength, fatigue life, and cost simultaneously.
6061-T6 gives the best manufacturability-to-cost ratio of the four candidates and a comfortable static margin for this load case. 7075-T6 is identified in the recommendations below as the direct upgrade path if the fatigue check calls for more margin.
- Alloy
- Al 6061-T6
- Tensile yield strength
- ≈ 276 MPa
- High-cycle fatigue strength
- ≈ 96.5 MPa
- Specific yield strength
- 102 kN·m/kg
Crank-arm materials compared Material Yield strength High-cycle fatigue strength Machinability / cost Al 6061-T6 (adopted) ≈ 276 MPa ≈ 96.5 MPa Excellent / Low Al 7075-T6 ≈ 503 MPa ≈ 159 MPa Good / Moderate 4130 Steel (N&T) ≈ 460 MPa ≈ 300–400 MPa Moderate / Low–Mod. Ti-6Al-4V ≈ 880 MPa ≈ 510 MPa Poor / High -
Mesh and solve
ANSYS Mechanical
The FE model uses the full-fidelity CAD geometry with no defeaturing, a locally refined mesh at the fixed-support holes, and is solved in ANSYS Mechanical’s Static Structural environment. The stress result is cross-checked against a closed-form flexure calculation at the same cross-section.
- Elements
- Quadratic SOLID187 / SOLID186
- Final mesh
- 8,845 nodes / 1,626 elements
- Refinement
- Default → 5 mm → 2.5 mm local
- Material model
- E = 68.9 GPa, ν = 0.33
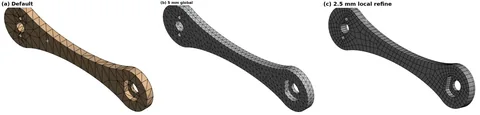
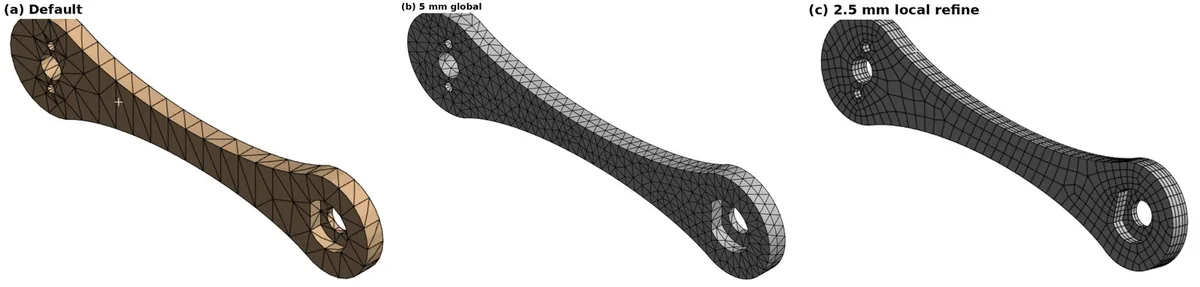
Mesh refinement: (a) default automatic mesh; (b) 5 mm global sizing; (c) 2.5 mm local refinement with a structured hexahedral mesh over the body. Select to enlarge. -
Read the results
ANSYS Mechanical
The model predicts a 0.455 mm tip deflection and a 91.5 MPa peak bending stress, giving a static factor of safety of ≈3.0 against yield, with fatigue emerging as the tighter constraint.
- Max total deformation
- 0.455 mm
- Normal stress σx
- +91.5 / −91.2 MPa
- Static factor of safety
- ≈ 3.0
- Margin to fatigue strength
- FS ≈ 1.05
Total deformation, animated (looped); same FE result detailed in Analysis 1 of the technical details. 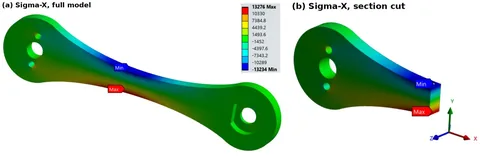
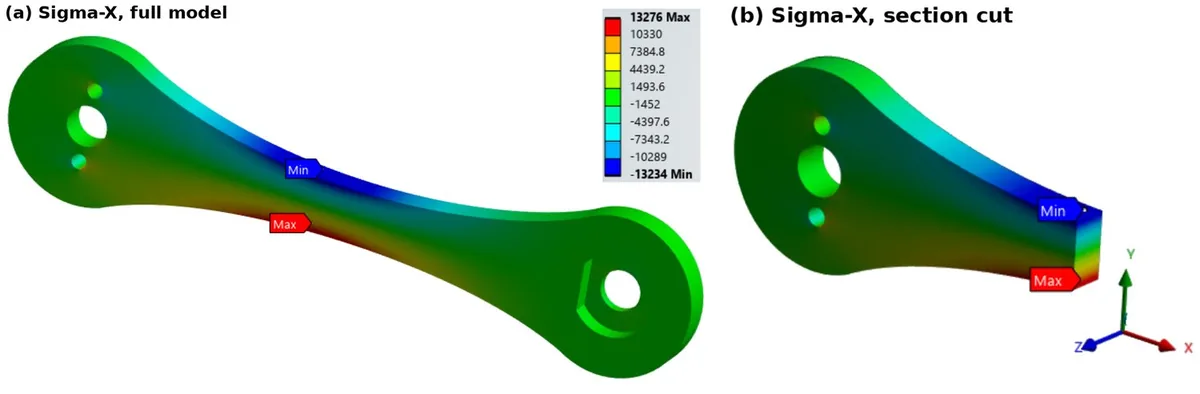
σx contour: full model (left) and section-plane cut through the neck (right). Select to enlarge.
How I checked the results
The FE solution is verified with an independent Euler–Bernoulli hand calculation and a reaction-force / traction equilibrium check, and the design is then checked for its static factor of safety and its margin to fatigue.
3.0×
static factor of safety against yield (σy 276 MPa ÷ σmax 91.5 MPa)
The finite element and hand-calculation results agree in sign, spatial pattern, and order of magnitude (Analysis 4 in the technical details). The more interesting question for this design is not yield; it’s fatigue: the peak operating stress sits close to the material’s high-cycle fatigue strength, addressed in the recommendations below.
Peak bending stress by method
Magnitude in MPa, at the neck cross-section. Dashed line marks the Al 6061-T6 high-cycle fatigue strength reference. Hover a bar for details.
| Verification / design check | Result | Target | Status |
|---|---|---|---|
| Reaction-force equilibrium | 444.8 N (Δ<0.01%) | ΣFy = applied load | Verified |
| Traction boundary condition | 1.8% difference | probed ≈ average applied | Verified |
| Hand-calc vs. FEA bending stress | +34% (hand-calc higher) | same order, conservative | Verified |
| Static factor of safety | ≈ 3.0 | ≥ 2.0 (design minimum) | Pass |
| Margin to high-cycle fatigue strength | FS ≈ 1.05 | comfortable margin | Tight, see recommendations |
Engineering judgment and recommendations
Beyond the pass/fail static check, the analysis surfaces where the design has room, and where fatigue, not yield, is the real constraint.
-
Flagged
Fatigue margin is the binding constraint
The FEA peak stress (91.5 MPa) sits just under the published high-cycle fatigue strength of 6061-T6 (≈96.5 MPa at 5×10⁸ cycles), a margin of only ≈5%. Aluminum has no true endurance limit, and the real peak local stress at the mounting-hole fillets (not evaluated here) will run higher due to stress concentration. Recommend a dedicated fatigue and stress-concentration study, incorporating the actual fillet geometry and a representative pedaling load spectrum, before production release. The published fatigue strengths come from fully reversed (R = −1) rotating-beam tests, so this comparison is a screening check; that study should use the actual load ratio with a mean-stress correction such as Goodman.
-
Static margin is comfortable
FS ≈ 3.0 against yield leaves headroom for standing and sprint efforts above the 444.8 N reference load, which represents a steady seated-cadence estimate rather than a peak instantaneous force.
-
Mesh convergence not yet formally verified
The refinement sequence in the analysis detail is qualitative. A quantitative convergence check, comparing peak stress against mesh density across three or more refinement levels, is recommended before this model is relied on for final sign-off.
-
7075-T6 is the direct upgrade path
If the fatigue check calls for more margin, Aluminum 7075-T6 offers ≈65% higher high-cycle fatigue strength for a modest cost and density penalty, without the machinability and cost disadvantages of titanium.
Technical details
The five analysis checks, the full method, and the complete material comparison.
Analysis detail Deformation, stress, mesh, hand calculation and equilibrium, one check at a time
Five checks, each isolating one part of the model: from raw displacement and stress output, through mesh quality, to the independent hand-calc and equilibrium checks that make the result trustworthy.
01. Deformation and displacement response
Displacement field
Under the 444.8 N pedal load, the crank behaves as a cantilever fixed at the bottom-bracket boss: deformation is zero at the three fixed holes and maximum at the pedal-side hole, with a smooth gradient along the neck and no visible twist, consistent with a dominantly bending response.
At true scale the deflection is imperceptible to the eye, as expected for a stiff aluminum lever of this size; magnifying it reveals a smooth, almost pure-bending shape with negligible twist. See the animated total-deformation contour in step 4.
02. Normal stress (σx) distribution
Stress field
Consistent with a cantilever bent by an upward tip load, the stress is tensile along the lower fiber of the neck and compressive along the upper fiber, with both extremes at the narrowest cross-section, the same location used for the hand-calculation cross-check in Analysis 4.
A section-plane cut through the neck shows an essentially linear through-thickness stress gradient, exactly what elementary beam-bending theory predicts for a section loaded in pure bending.
03. Mesh generation and refinement
Mesh quality
Mesh density was built up in three passes, concentrating element density at the fixed-support holes, the region of steepest stress gradient, while keeping the neck, where the stress field is smooth, comparatively coarse.
A quantitative mesh-convergence study was not carried out beyond this refinement sequence; it’s flagged as follow-on work in the recommendations before this model is relied on for final sign-off.
04. Hand-calculation verification
Independent check
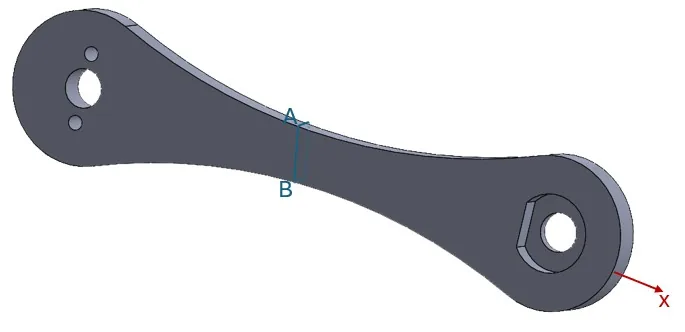
The crank is idealized as a straight cantilever and checked at the same neck cross-section used for the FE stress extraction. The hand-calculated stress runs about a third higher than the FE result, which is expected, and on the conservative side, since the rectangular-section idealization neglects the R25 fillets, and the neck height was taken from a scaled measurement rather than a native CAD dimension.
M = P·(L−x) = 37.8 N·m σ = Mc/I
Difference: +34%, hand-calc higher, the conservative direction for a verification check.
05. Boundary conditions and equilibrium check
Model integrity
Reaction forces at the three fixed holes are checked against the applied load, and the probed traction at the loaded hole is checked against the average traction implied by the applied force and loaded area: necessary (though not sufficient) checks that the model behaves as specified before its results are trusted.
Both checks pass to within normal numerical / engineering tolerance.
Method Hand-calc equation, geometry, elements, mesh, boundary conditions and material model
M = P·(L − x) σ = M·c / I
Euler–Bernoulli flexure, used as the independent hand-calc cross-check (Analysis 4).
- Full CAD geometry retained, with no defeaturing; all holes and fillets meshed as-modeled.
- Quadratic tetrahedral (SOLID187) and hexahedral (SOLID186) elements throughout.
- Three-pass mesh refinement: default automatic → 5 mm global → 2.5 mm local at the fixed-support holes.
- Final mesh: 8,845 nodes / 1,626 elements after refinement.
- Boundary conditions: fixed support (u = v = w = 0) at the three bottom-bracket holes; 444.8 N (100 lbf) traction at the pedal-side hole.
- Material: Aluminum 6061-T6, linear-elastic isotropic, E = 68.9 GPa, ν = 0.33.
Material comparison Strength, stiffness, fatigue, specific strength and cost of the four candidates
| Property | Al 6061-T6 | Al 7075-T6 | 4130 Steel (N&T) | Ti-6Al-4V |
|---|---|---|---|---|
| Density | 2.70 g/cm³ | 2.81 g/cm³ | 7.85 g/cm³ | 4.43 g/cm³ |
| Tensile yield strength | ≈ 276 MPa | ≈ 503 MPa | ≈ 460 MPa | ≈ 880 MPa |
| Ultimate tensile strength | ≈ 310 MPa | ≈ 572 MPa | ≈ 670 MPa | ≈ 950 MPa |
| Elastic modulus, E | 68.9 GPa | 71.7 GPa | ≈ 205 GPa | ≈ 114 GPa |
| Elongation at break | ≈ 12–17% | ≈ 11% | ≈ 20–25% | ≈ 10–14% |
| High-cycle fatigue strength | ≈ 96.5 MPa | ≈ 159 MPa | ≈ 300–400 MPa | ≈ 510 MPa |
| Specific yield strength | 102 kN·m/kg | 179 kN·m/kg | 59 kN·m/kg | 199 kN·m/kg |
| Machinability / cost | Excellent / Low | Good / Moderate | Moderate / Low–Mod. | Poor / High |
6061-T6 gives the best manufacturability-to-cost ratio of the four candidates and a comfortable static margin for this load case. 7075-T6 is identified in the recommendations as the direct upgrade path if the fatigue check calls for more margin.